Federated Tracing with OpenTelemetry: Finding the Subgraph That's Lying to You
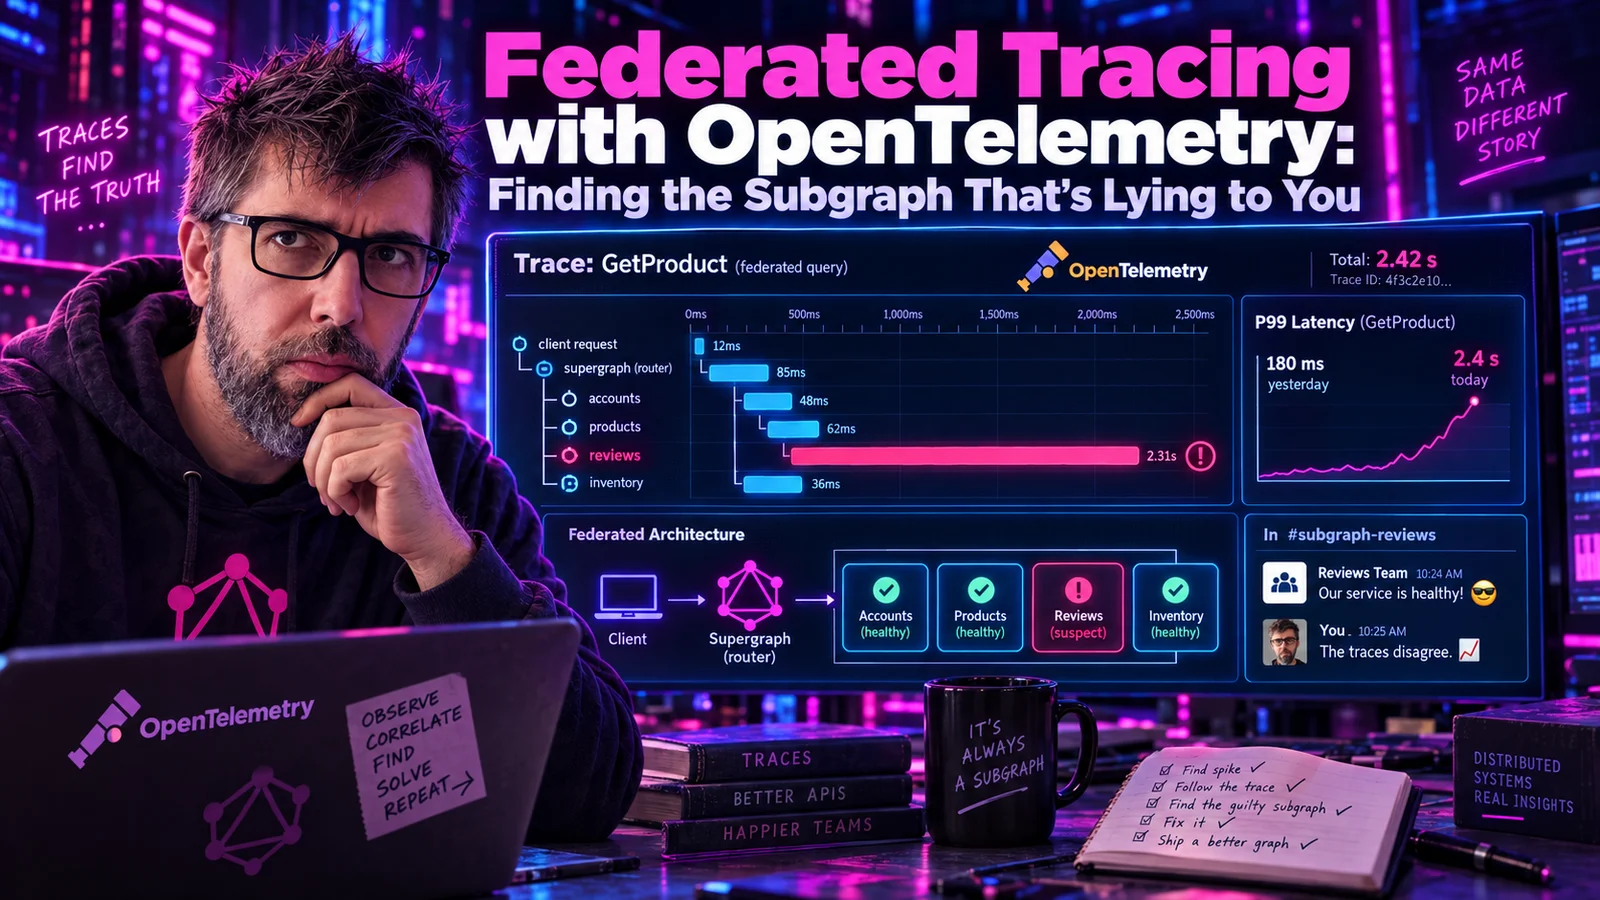
Your P99 just spiked from 180ms to 2.4 seconds. Your supergraph has eight subgraphs. Each subgraph team insists they're healthy. The dashboards on each individual service are green. The router is sweating. Somebody is lying. Without proper tracing across the federation, you're going to spend the next three hours on a war room Zoom call doing forensics with timestamps.
The Problem With Federated Observability
A single GraphQL request in a federated architecture is not a single HTTP call. It's a dance:
Client
   ↓
Router (plans)
   ↓
Subgraph A (users) ─→ returns partial result
   ↓
Subgraph B (orders) ─→ needs data from A, waits, then queries
   ↓
Subgraph C (inventory) ─→ parallel with B
   ↓
Router (merges)
   ↓
Client
Each arrow is a hop. Each hop can fail, slow down, or return garbage. When something goes wrong, "which service was slow" becomes a question you can only answer if every service and the router share a correlation ID and export their spans to the same tracing backend.
Without that: you are staring at a stopwatch across eight dashboards and eyeballing "which one looks suspicious." This is not a debugging strategy. It's a cry for help.
Why OpenTelemetry Won
Three years ago, you had Jaeger, Zipkin, Datadog's custom format, New Relic's custom format, Honeycomb's beeline, and a dozen vendor-specific libraries. Each one had its own SDK, its own context propagation rules, and its own way to add custom spans. Switching backends meant rewriting your instrumentation.
OpenTelemetry ended that war. It's now the CNCF-blessed standard, and as of 2026, every major tracing backend speaks OTLP (OpenTelemetry Protocol). Your instrumentation code is vendor-neutral. You export to Jaeger, Honeycomb, Datadog, Grafana Tempo, or New Relic by changing an endpoint URL.
- SDKs for every language (Java, Go, Python, Node, Rust, etc.)
- Auto-instrumentation for common frameworks (Spring Boot, Express, Flask, ...)
- OTLP wire protocol over gRPC or HTTP
- Collector - an agent that receives, batches, transforms, and forwards spans
- Backends - Jaeger, Grafana Tempo, Honeycomb, Datadog, et al., all speak OTLP
For GraphQL federation specifically, OpenTelemetry is no longer optional. It's the only reasonable way to trace a request that hops through a router and three subgraphs.
The Apollo Router: First-Class OpenTelemetry
Apollo Router (v2.x) ships OpenTelemetry support in the base image. You configure it via YAML and span export just works:
# router.yaml
telemetry:
  instrumentation:
    spans:
      mode: spec_compliant
  exporters:
    tracing:
      propagation:
        trace_context: true
        baggage: true
      otlp:
        enabled: true
        endpoint: http://otel-collector:4317
        protocol: grpc
Three things are happening here:
- Propagation - The router reads and writes W3C trace context headers, so a client-side trace continues through the router and into subgraphs.
- Instrumentation - The router emits its own spans for query planning, query execution, and each subgraph fetch.
- Export - Spans go to an OpenTelemetry Collector, which fans out to your actual backend.
The router will automatically add HTTP headers to subgraph requests that let subgraphs continue the trace. If your subgraphs are OpenTelemetry-instrumented, they'll add their spans to the same trace ID.
Wiring Up a Spring GraphQL Subgraph
Spring Boot's OpenTelemetry integration is in good shape in 2026. The autoconfigured starter covers most of what you need:
<!-- pom.xml -->
<dependency>
    <groupId>io.opentelemetry.instrumentation</groupId>
    <artifactId>opentelemetry-spring-boot-starter</artifactId>
</dependency>
# application.yaml
otel:
  service:
    name: users-subgraph
  exporter:
    otlp:
      endpoint: http://otel-collector:4317
  traces:
    exporter: otlp
  metrics:
    exporter: otlp
  logs:
    exporter: otlp
  propagators: tracecontext,baggage
Out of the box, this gives you:
- HTTP server spans for every inbound GraphQL request
- JDBC spans for every database query
- Outbound HTTP client spans for every
RestTemplateorWebClientcall - Automatic trace context propagation through
@Asyncboundaries
What's missing: GraphQL-aware spans. A Spring GraphQL request shows up as an HTTP POST to /graphql in your trace, which is about as useful as "something happened." You want a span per field resolver, a span per DataLoader batch, and a span that names the operation.
Adding GraphQL-Native Spans
Spring GraphQL lets you intercept execution via GraphQlInterceptor and DataFetcherExceptionResolver. Combine those with a custom Instrumentation (from graphql-java) and you get trace visibility that actually tells you something.
@Component
public class GraphQlTracingInstrumentation extends SimplePerformantInstrumentation {

    private final Tracer tracer;

    public GraphQlTracingInstrumentation(OpenTelemetry otel) {
        this.tracer = otel.getTracer("graphql");
    }

    @Override
    public InstrumentationContext<ExecutionResult> beginExecution(
            InstrumentationExecutionParameters params) {

        String operationName = params.getOperation() != null
            ? params.getOperation()
            : "anonymous";

        Span span = tracer.spanBuilder("graphql.execute " + operationName)
            .setSpanKind(SpanKind.SERVER)
            .setAttribute("graphql.operation.name", operationName)
            .setAttribute("graphql.document", truncate(params.getQuery(), 1000))
            .startSpan();

        try (Scope ignored = span.makeCurrent()) {
            return new InstrumentationContext<>() {
                @Override
                public void onDispatched(CompletableFuture<ExecutionResult> future) {}

                @Override
                public void onCompleted(ExecutionResult result, Throwable t) {
                    if (t != null) {
                        span.recordException(t);
                        span.setStatus(StatusCode.ERROR);
                    }
                    if (result != null && !result.getErrors().isEmpty()) {
                        span.setAttribute("graphql.errors.count",
                            result.getErrors().size());
                        span.setStatus(StatusCode.ERROR, "graphql errors");
                    }
                    span.end();
                }
            };
        }
    }

    @Override
    public InstrumentationContext<Object> beginFieldFetch(
            InstrumentationFieldFetchParameters params) {

        String fieldPath = params.getEnvironment()
            .getExecutionStepInfo().getPath().toString();

        Span span = tracer.spanBuilder("graphql.field " + fieldPath)
            .setAttribute("graphql.field.path", fieldPath)
            .setAttribute("graphql.field.type",
                params.getEnvironment().getFieldType().toString())
            .startSpan();

        return new InstrumentationContext<>() {
            @Override
            public void onDispatched(CompletableFuture<Object> future) {}

            @Override
            public void onCompleted(Object result, Throwable t) {
                if (t != null) {
                    span.recordException(t);
                    span.setStatus(StatusCode.ERROR);
                }
                span.end();
            }
        };
    }
}
Register it in your Spring GraphQL config:
@Configuration
public class GraphQlConfig {

    @Bean
    public GraphQlSourceBuilderCustomizer customizer(
            GraphQlTracingInstrumentation instrumentation) {
        return builder -> builder.configureGraphQl(graphQl ->
            graphQl.instrumentation(instrumentation)
        );
    }
}
Now each GraphQL request produces a tree of spans you can actually read:
POST /graphql                              (HTTP server span from auto-instrumentation)
  └── graphql.execute UserProfile       (from our instrumentation)
        ├── graphql.field /user             (field span)
        │     └── SELECT * FROM users       (JDBC span from auto-instrumentation)
        ├── graphql.field /user/orders      (field span)
        │     └── GET /orders?userId=123    (HTTP client span)
        └── graphql.field /user/preferences (field span)
              └── SELECT * FROM prefs       (JDBC span)
The Magic Moment: Seeing Cross-Subgraph Latency
Here's what federated tracing actually gets you. A slow query comes in, you find the trace, and you see:
[root trace - 2.4s total]
  router.plan_query                30ms
  router.subgraph.fetch users      45ms   ← fast
  router.subgraph.fetch orders    2280ms  ← oh no
    HTTP POST /graphql             2275ms
      graphql.execute GetOrders    2270ms
        graphql.field /orders       12ms
        graphql.field /orders/items 8ms
          SELECT items WHERE ...  2250ms  ← the actual villain
  router.merge_response             15ms
Without federation tracing, you'd see "the router took 2.4 seconds" and stop. With federation tracing, you see "the orders subgraph's items query hit a missing database index." One is a line item on a Jira ticket. The other is a three-hour debugging session.
- Subgraph latency distribution. Which subgraph is the slowest hop?
- Sequential vs parallel. Is the router waiting on subgraph A before calling B? That's a fetch planner decision worth examining.
- Field-level spans. Which specific resolver is blocking?
- Database spans. How many queries is one field triggering? (Hint: if it's N, you're missing a DataLoader.)
- N+1 patterns. A trace with 50 sibling spans of the same name is a DataLoader waiting to happen.
The OpenTelemetry Collector: Don't Skip This
Here's the mistake every team makes on first OpenTelemetry rollout: they point every service directly at their tracing backend. This works on day one. It explodes on day thirty when:
- Every service holds its own connection to the backend
- Sampling decisions are made inconsistently
- You need to add a new tag retroactively (impossible - already sent)
- You want to switch backends
The OpenTelemetry Collector solves all of this. It runs as a sidecar or daemonset in your cluster, receives OTLP from your services, and forwards to one or more backends. Between "receive" and "forward" you can transform, sample, enrich, or route.
# collector.yaml
receivers:
  otlp:
    protocols:
      grpc:
        endpoint: 0.0.0.0:4317

processors:
  batch:
    timeout: 10s
  resource:
    attributes:
      - key: deployment.environment
        value: production
        action: insert
  tail_sampling:
    decision_wait: 10s
    policies:
      - name: errors
        type: status_code
        status_code:
          status_codes: [ERROR]
      - name: slow-requests
        type: latency
        latency:
          threshold_ms: 500
      - name: sample-rest
        type: probabilistic
        probabilistic:
          sampling_percentage: 5

exporters:
  otlp/tempo:
    endpoint: tempo:4317
    tls:
      insecure: true

service:
  pipelines:
    traces:
      receivers: [otlp]
      processors: [resource, tail_sampling, batch]
      exporters: [otlp/tempo]
The tail sampler keeps 100% of errors, 100% of slow requests, and 5% of normal traffic. That's a 95% cost reduction with almost no signal loss. Your SRE team will buy you coffee.
Apollo Router + OpenTelemetry in Practice
A few things the Apollo docs will tell you but are worth emphasizing:
Operation Name is a Trace Attribute
Make sure every client sends a named operation. query UserProfile beats query { ... } because your traces become groupable. When you look at "latency by operation" charts, anonymous queries all merge into one bucket you can't debug.
Subgraph Request Headers Propagate
The router by default adds traceparent and tracestate headers to subgraph requests. Your subgraphs need to be configured to read those headers (OpenTelemetry auto-instrumentation does this). Miss the config, and your subgraph starts a new trace instead of continuing the existing one, fragmenting the view.
Error Traces Are The Highest-Signal Traces
Always sample 100% of errored requests. They're rare, they're tiny in aggregate, and they're the single highest-value data you have when something breaks. A tail sampler with an error policy is the baseline every setup should have.
Metrics Matter Too
OpenTelemetry isn't just traces. Apollo Router exports metrics for query planning duration, subgraph request counts, cache hit rates, and more. Wire these into Prometheus or a Grafana Cloud endpoint. Your "is the router healthy" dashboard wants these numbers.
Common Gotchas
Gotcha #1: Trace context lost across async boundaries.
Spring's @Async, Reactor's Mono.publishOn, CompletableFutures created with supplyAsync can drop the trace context. OpenTelemetry's opentelemetry-instrumentation-annotations artifact plus @WithSpan annotations fix most cases. For custom executors, wrap them with Context.taskWrapping(executor).
Gotcha #2: Query text too long.
Your instrumentation adds the full GraphQL document as a span attribute. There's no universal "spans dropped above N bytes" rule, but in practice attribute-value-length limits in the OTel SDK (configurable via otel.attribute.value.length.limit) and gRPC max-message size (default 4MB) at the OTLP exporter both apply. Long queries also bloat your tracing storage and search index. Truncate or hash the document, or limit yourself to graphql.operation.name plus a sampled subset of full documents.
Gotcha #3: Sensitive data in variables. GraphQL variables contain real user data. If you add them as span attributes, you just shipped PII to your tracing backend. Either scrub them, hash them, or don't include them.
Gotcha #4: Cardinality explosion from field names.
If you add graphql.field.name as a metric label, and your schema has 5000 fields across 50 services, your metrics cardinality just jumped by 5000x. This is how you DoS your own Prometheus instance. Sample or drop field-level metrics.
Gotcha #5: Naming collisions across subgraphs.
Two subgraphs both have a User type. Their spans look identical in the trace UI. Always include the service name (service.name resource attribute) so you can distinguish them.
What Your Dashboard Should Look Like
A good federated tracing setup gives you, at minimum:
- Per-operation latency percentiles.
p50,p95,p99by operation name. - Subgraph fetch latency heatmap. Rows = subgraphs, columns = time, color = latency.
- Error rate by subgraph. Who's failing, and how often.
- Slow trace explorer. Top 50 slowest traces in the last hour, clickable.
- Query plan duration. Is the router spending too long planning?
Grafana, Honeycomb, Datadog, and Jaeger all have templates for this. Use one. Don't build from scratch unless you really want to.
The Honest Operational Truth
Federated tracing is a solved problem in 2026 but only if you set it up properly. The tools exist. The standards exist. The instrumentation libraries exist. What's missing, usually, is the discipline to wire them up before you need them.
Teams that invest in tracing early never regret it. Teams that skip it eventually spend a week doing observability work at 3 AM because a customer noticed something before their monitoring did.
Do it now. While everything is green. Your future on-call self will thank you. And when the P99 spikes next Tuesday at 11 PM, you'll click one link in Slack, see the subgraph that's lying, and be back in bed in fifteen minutes instead of three hours.
This post was traced through four drafts, two editing sessions, and one coffee break. The coffee was the slowest span.
Sources
- Apollo Router Telemetry Configuration
- OpenTelemetry Documentation
- OneUptime: How to Instrument Apollo GraphQL Server with OpenTelemetry for Federated Graph Trace Visibility
- OpenTelemetry Spring Boot Starter
- W3C Trace Context Specification
- OpenTelemetry Collector Documentation
- Apollo: Evolving the Federated GraphQL Platform at Netflix