Deploying Spring GraphQL to Production - Configuration and Monitoring
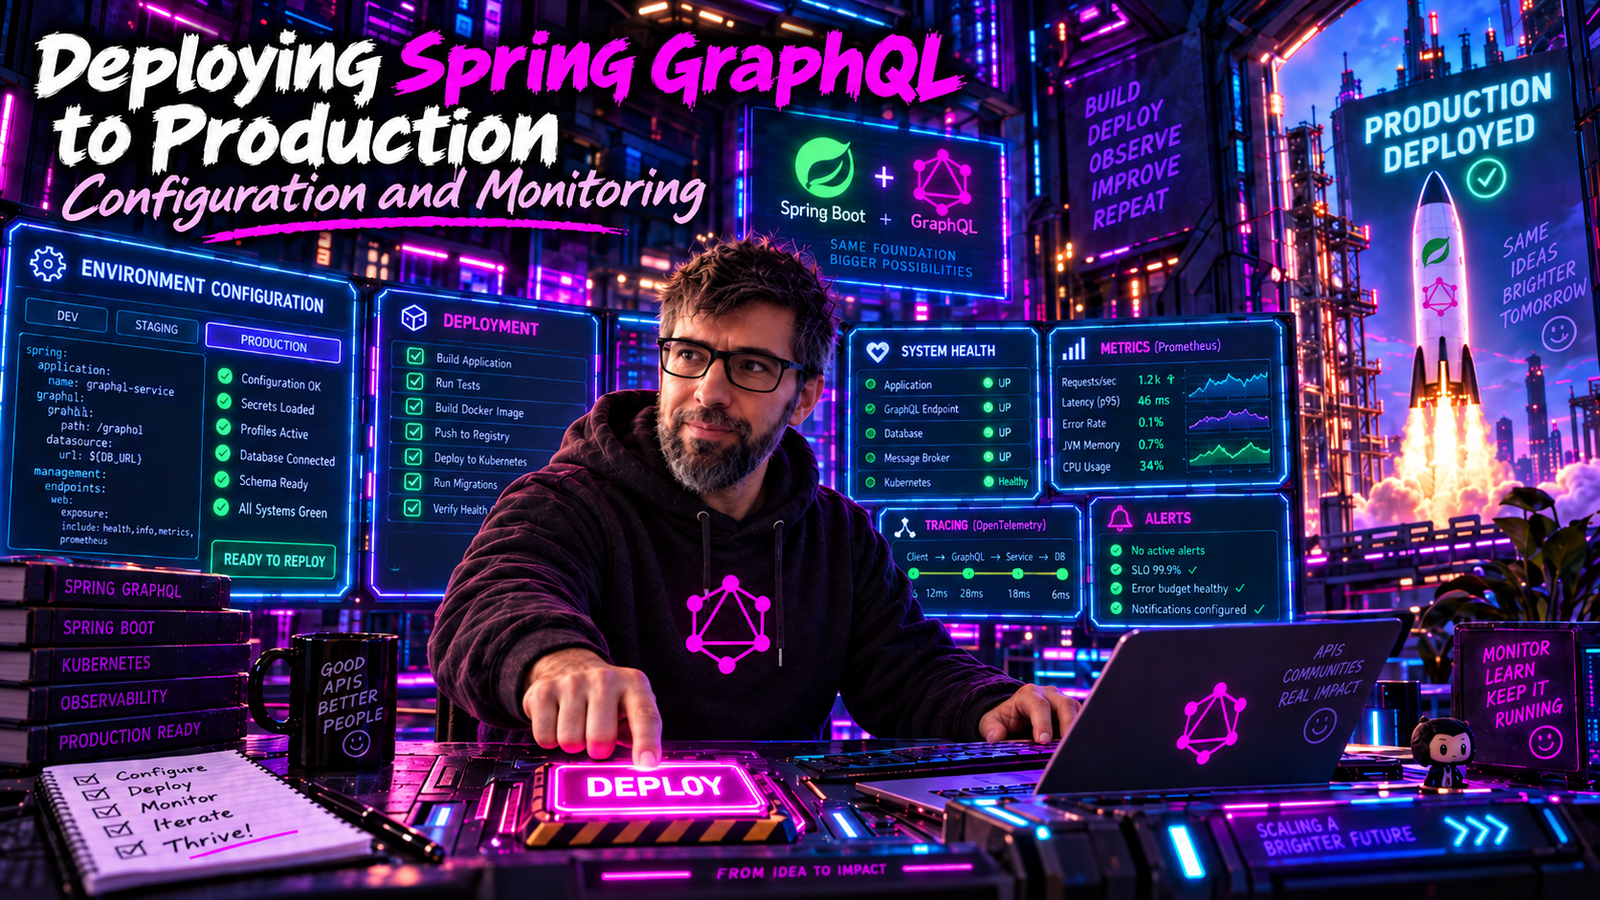
Your Spring GraphQL API works locally. Now let's make it production-ready with proper configuration, monitoring, security hardening, and operational best practices.
Production Configuration
Application Properties
# application-production.yml
spring:
  graphql:
    graphiql:
      enabled: false  # Disable in production
    schema:
      introspection:
        enabled: false  # Stops the one-request schema dump
      printer:
        enabled: false
    websocket:
      connection-init-timeout: 30s

  jpa:
    open-in-view: false
    show-sql: false
    properties:
      hibernate:
        generate_statistics: false

server:
  port: 8080
  compression:
    enabled: true
    mime-types: application/json,application/graphql-response+json

management:
  endpoints:
    web:
      exposure:
        include: health,info,metrics,prometheus
  endpoint:
    health:
      show-details: when-authorized
  metrics:
    tags:
      application: ${spring.application.name}

logging:
  level:
    root: WARN
    com.yourcompany: INFO
    org.springframework.graphql: INFO
Security Configuration
@Configuration
@EnableWebSecurity
@Profile("production")
public class ProductionSecurityConfig {

    @Bean
    public SecurityFilterChain filterChain(HttpSecurity http) throws Exception {
        http
            .csrf(csrf -> csrf.disable())
            .headers(headers -> headers
                .contentSecurityPolicy(csp -> csp
                    .policyDirectives("default-src 'self'"))
                .frameOptions(frame -> frame.deny())
            )
            .authorizeHttpRequests(auth -> auth
                .requestMatchers("/actuator/health").permitAll()
                .requestMatchers("/actuator/**").hasRole("ADMIN")
                .requestMatchers("/graphql").authenticated()
                .anyRequest().denyAll()
            )
            .oauth2ResourceServer(oauth2 -> oauth2
                .jwt(jwt -> jwt.jwtAuthenticationConverter(jwtConverter()))
            )
            .sessionManagement(session ->
                session.sessionCreationPolicy(SessionCreationPolicy.STATELESS));

        return http.build();
    }
}
Query Protection
Complexity Analysis
Prevent expensive queries from overwhelming your server:
@Configuration
public class GraphQLSecurityConfig {

    @Bean
    public Instrumentation maxQueryComplexityInstrumentation() {
        return new MaxQueryComplexityInstrumentation(100);
    }

    @Bean
    public Instrumentation maxQueryDepthInstrumentation() {
        return new MaxQueryDepthInstrumentation(10);
    }

    @Bean
    public WebGraphQlInterceptor queryTimeoutInterceptor() {
        return (request, chain) -> chain.next(request)
            .timeout(Duration.ofSeconds(30))
            .onErrorMap(TimeoutException.class, e ->
                new QueryTimeoutException("Query exceeded the 30s budget"));
    }
}
WebGraphQlResponse does not expose a static builder(). It wraps an
ExecutionGraphQlResponse and exposes transform(Consumer<Builder>) on an
existing instance, so an interceptor that never got a response cannot transform anything. Map the timeout to an exception and let a
DataFetcherExceptionResolver turn it into a GraphQL error, which is the same
path every other error in your application already takes.
Rate Limiting
@Component
public class RateLimitInterceptor implements WebGraphQlInterceptor {

    private static final RateLimiterConfig CONFIG = RateLimiterConfig.custom()
        .limitForPeriod(100)
        .limitRefreshPeriod(Duration.ofMinutes(1))
        .timeoutDuration(Duration.ZERO)   // fail fast, never block the thread
        .build();

    private final RateLimiterRegistry rateLimiterRegistry;

    public RateLimitInterceptor(RateLimiterRegistry rateLimiterRegistry) {
        this.rateLimiterRegistry = rateLimiterRegistry;
    }

    @Override
    public Mono<WebGraphQlResponse> intercept(WebGraphQlRequest request, Chain chain) {
        String clientId = extractClientId(request);
        RateLimiter limiter = rateLimiterRegistry.rateLimiter(clientId, CONFIG);

        if (!limiter.acquirePermission()) {
            return Mono.error(new RateLimitExceededException(
                "Rate limit exceeded. Try again later."));
        }
        return chain.next(request);
    }
}
rateLimiterRegistry.rateLimiter(clientId, config) creates a limiter on first
use and keeps it. With one limiter per client id, that is an unbounded map: every
client that ever connects leaves an entry behind, and nothing evicts it. On a
public endpoint with one limiter per IP address, this is a slow memory leak with
an attacker-controlled growth rate.
For anything client-facing, hold the limiters in a bounded cache with an idle
expiry (Caffeine with expireAfterAccess works well) and build the limiter
yourself with RateLimiter.of(clientId, CONFIG) on a cache miss.
Metrics and Monitoring
Micrometer Integration
Spring GraphQL automatically integrates with Micrometer:
@Configuration
public class MetricsConfig {

    @Bean
    public ExecutionRequestObservationConvention graphQlObservationConvention() {
        return new DefaultExecutionRequestObservationConvention();
    }

    @Bean
    public MeterRegistryCustomizer<MeterRegistry> metricsCommonTags() {
        return registry -> registry.config()
            .commonTags("application", "graphql-api")
            .commonTags("environment", "production");
    }
}
Available metrics:
graphql.request- Request count and timinggraphql.datafetcher- Data fetcher timing (per non-trivial data fetcher)graphql.dataloader- DataLoader batch-load timings
Custom Metrics
@Component
public class GraphQLMetricsInterceptor implements WebGraphQlInterceptor {

    private final MeterRegistry meterRegistry;
    private final Counter queryCounter;
    private final Counter mutationCounter;
    private final Timer queryTimer;

    public GraphQLMetricsInterceptor(MeterRegistry meterRegistry) {
        this.meterRegistry = meterRegistry;
        this.queryCounter = Counter.builder("graphql.operations")
            .tag("type", "query")
            .register(meterRegistry);
        this.mutationCounter = Counter.builder("graphql.operations")
            .tag("type", "mutation")
            .register(meterRegistry);
        this.queryTimer = Timer.builder("graphql.query.duration")
            .register(meterRegistry);
    }

    @Override
    public Mono<WebGraphQlResponse> intercept(WebGraphQlRequest request, Chain chain) {
        long startTime = System.nanoTime();
        String operationType = extractOperationType(request);

        return chain.next(request)
            .doOnSuccess(response -> {
                long duration = System.nanoTime() - startTime;
                queryTimer.record(duration, TimeUnit.NANOSECONDS);

                if ("query".equals(operationType)) {
                    queryCounter.increment();
                } else if ("mutation".equals(operationType)) {
                    mutationCounter.increment();
                }

                // Track errors. Tag with the error type only: it comes from a
                // fixed enum. Never tag with the operation name, which the
                // client chooses and can vary without limit.
                if (!response.getErrors().isEmpty()) {
                    ErrorClassification type =
                        response.getErrors().get(0).getErrorType();
                    meterRegistry.counter("graphql.errors",
                        "type", type != null ? type.toString() : "UNKNOWN"
                    ).increment();
                }
            });
    }
}
Prometheus Export
# application.yml
management:
  endpoints:
    web:
      exposure:
        include: prometheus
  prometheus:
    metrics:
      export:
        enabled: true
Prometheus scrape config:
scrape_configs:
  - job_name: 'spring-graphql'
    metrics_path: '/actuator/prometheus'
    static_configs:
      - targets: ['localhost:8080']
Distributed Tracing
OpenTelemetry Integration
<dependency>
    <groupId>io.opentelemetry</groupId>
    <artifactId>opentelemetry-api</artifactId>
</dependency>
<dependency>
    <groupId>io.micrometer</groupId>
    <artifactId>micrometer-tracing-bridge-otel</artifactId>
</dependency>
Pick one tracing API and stay in it. The dependency above brings in
micrometer-tracing-bridge-otel, which means you inject
io.micrometer.tracing.Tracer and use Micrometer's vocabulary. Micrometer has
nextSpan(), tag(...) and error(...); spanBuilder(...),
setAttribute(...) and recordException(...) belong to the OpenTelemetry
Tracer underneath the bridge. Mixing them gives you code that resolves against
neither import set.
import io.micrometer.tracing.Span;
import io.micrometer.tracing.Tracer;

@Configuration
public class TracingConfig {

    @Bean
    public WebGraphQlInterceptor tracingInterceptor(Tracer tracer) {
        return (request, chain) -> {
            Span span = tracer.nextSpan()
                .name("graphql.request")
                .tag("graphql.operation", extractOperationName(request))
                .tag("graphql.operationType", extractOperationType(request))
                .start();

            return chain.next(request)
                .doOnSuccess(response -> {
                    if (!response.getErrors().isEmpty()) {
                        span.error(new GraphQlExecutionException(
                            response.getErrors().get(0).getMessage()));
                    }
                    span.end();
                })
                .doOnError(error -> {
                    span.error(error);
                    span.end();
                });
        };
    }
}
Before you write any of this, check whether you need it. Spring GraphQL already
publishes graphql.request and graphql.datafetcher observations through
Micrometer, and with the OTel bridge on the classpath those become spans without
an interceptor. Write your own only for attributes the built-in observations do
not carry.
Logging
Structured Logging
@Component
public class RequestLoggingInterceptor implements WebGraphQlInterceptor {

    private static final Logger log = LoggerFactory.getLogger(RequestLoggingInterceptor.class);

    @Override
    public Mono<WebGraphQlResponse> intercept(WebGraphQlRequest request, Chain chain) {
        String requestId = UUID.randomUUID().toString();
        long startTime = System.currentTimeMillis();

        MDC.put("requestId", requestId);
        MDC.put("operationName", extractOperationName(request));

        log.info("GraphQL request started");

        return chain.next(request)
            .doOnSuccess(response -> {
                long duration = System.currentTimeMillis() - startTime;

                log.info("GraphQL request completed: duration={}ms, errors={}",
                    duration,
                    response.getErrors().size());

                MDC.clear();
            })
            .doOnError(error -> {
                log.error("GraphQL request failed", error);
                MDC.clear();
            });
    }
}
Log Format (JSON)
<!-- logback-spring.xml -->
<configuration>
    <appender name="CONSOLE" class="ch.qos.logback.core.ConsoleAppender">
        <encoder class="net.logstash.logback.encoder.LogstashEncoder">
            <includeMdc>true</includeMdc>
            <includeContext>false</includeContext>
        </encoder>
    </appender>

    <root level="INFO">
        <appender-ref ref="CONSOLE"/>
    </root>
</configuration>
Output:
{
  "@timestamp": "2024-03-25T10:30:00.000Z",
  "level": "INFO",
  "message": "GraphQL request completed: duration=45ms, errors=0",
  "requestId": "abc-123",
  "operationName": "Books"
}
Health Checks
@Component
public class GraphQLHealthIndicator implements HealthIndicator {

    private final ExecutionGraphQlService graphQlService;

    @Override
    public Health health() {
        try {
            // Execute a simple health check query
            ExecutionResult result = graphQlService.execute(
                ExecutionInput.newExecutionInput()
                    .query("query HealthCheck { __typename }")
                    .build()
            ).block(Duration.ofSeconds(5));

            if (result.getErrors().isEmpty()) {
                return Health.up()
                    .withDetail("graphql", "Schema loaded")
                    .build();
            } else {
                return Health.down()
                    .withDetail("errors", result.getErrors())
                    .build();
            }
        } catch (Exception e) {
            return Health.down()
                .withException(e)
                .build();
        }
    }
}
Caching
Response Caching
@Component
public class CachingInterceptor implements WebGraphQlInterceptor {

    private final Cache<String, WebGraphQlResponse> cache;

    public CachingInterceptor() {
        this.cache = Caffeine.newBuilder()
            .maximumSize(1000)
            .expireAfterWrite(Duration.ofMinutes(5))
            .build();
    }

    @Override
    public Mono<WebGraphQlResponse> intercept(WebGraphQlRequest request, Chain chain) {
        // Only cache queries, not mutations
        if (!isQuery(request)) {
            return chain.next(request);
        }

        String cacheKey = buildCacheKey(request);
        WebGraphQlResponse cached = cache.getIfPresent(cacheKey);

        if (cached != null) {
            return Mono.just(cached);
        }

        return chain.next(request)
            .doOnSuccess(response -> {
                if (response.getErrors().isEmpty()) {
                    cache.put(cacheKey, response);
                }
            });
    }

    private String buildCacheKey(WebGraphQlRequest request) {
        return DigestUtils.sha256Hex(
            request.getDocument() + request.getVariables().toString()
        );
    }
}
HTTP Caching Headers
@Component
public class HttpCacheInterceptor implements WebGraphQlInterceptor {

    @Override
    public Mono<WebGraphQlResponse> intercept(WebGraphQlRequest request, Chain chain) {
        return chain.next(request)
            .map(response -> {
                // Add cache headers for successful queries
                if (isQuery(request) && response.getErrors().isEmpty()) {
                    response.getResponseHeaders().add(
                        HttpHeaders.CACHE_CONTROL,
                        "max-age=60, public"
                    );
                }
                return response;
            });
    }
}
Docker Deployment
Dockerfile
FROM eclipse-temurin:21-jre-alpine

WORKDIR /app

# Add non-root user
RUN addgroup -S spring && adduser -S spring -G spring
USER spring:spring

# Copy the jar
COPY --chown=spring:spring target/*.jar app.jar

# Health check
HEALTHCHECK --interval=30s --timeout=3s --start-period=30s --retries=3 \
  CMD wget -q --spider http://localhost:8080/actuator/health || exit 1

# JVM settings for containers
ENV JAVA_OPTS="-XX:+UseContainerSupport -XX:MaxRAMPercentage=75.0"

ENTRYPOINT ["sh", "-c", "java $JAVA_OPTS -jar app.jar"]
Docker Compose
version: '3.8'
services:
  graphql-api:
    build: .
    ports:
      - "8080:8080"
    environment:
      - SPRING_PROFILES_ACTIVE=production
      - SPRING_DATASOURCE_URL=jdbc:postgresql://db:5432/graphql
      - SPRING_DATASOURCE_USERNAME=app
      - SPRING_DATASOURCE_PASSWORD=${DB_PASSWORD}
      - JAVA_OPTS=-XX:MaxRAMPercentage=75.0 -Xlog:gc*
    depends_on:
      db:
        condition: service_healthy
    healthcheck:
      test: ["CMD", "wget", "-q", "--spider", "http://localhost:8080/actuator/health"]
      interval: 30s
      timeout: 10s
      retries: 3

  db:
    image: postgres:15-alpine
    environment:
      - POSTGRES_DB=graphql
      - POSTGRES_USER=app
      - POSTGRES_PASSWORD=${DB_PASSWORD}
    volumes:
      - pgdata:/var/lib/postgresql/data
    healthcheck:
      test: ["CMD-SHELL", "pg_isready -U app"]
      interval: 10s
      timeout: 5s
      retries: 5

volumes:
  pgdata:
Kubernetes Deployment
# deployment.yaml
apiVersion: apps/v1
kind: Deployment
metadata:
  name: graphql-api
spec:
  replicas: 3
  selector:
    matchLabels:
      app: graphql-api
  template:
    metadata:
      labels:
        app: graphql-api
    spec:
      containers:
        - name: graphql-api
          image: your-registry/graphql-api:latest
          ports:
            - containerPort: 8080
          env:
            - name: SPRING_PROFILES_ACTIVE
              value: "production"
            - name: JAVA_OPTS
              value: "-XX:MaxRAMPercentage=75.0"
          resources:
            requests:
              memory: "512Mi"
              cpu: "250m"
            limits:
              memory: "1Gi"
              cpu: "1000m"
          livenessProbe:
            httpGet:
              path: /actuator/health/liveness
              port: 8080
            initialDelaySeconds: 60
            periodSeconds: 10
          readinessProbe:
            httpGet:
              path: /actuator/health/readiness
              port: 8080
            initialDelaySeconds: 30
            periodSeconds: 5
---
apiVersion: v1
kind: Service
metadata:
  name: graphql-api
spec:
  selector:
    app: graphql-api
  ports:
    - port: 80
      targetPort: 8080
  type: ClusterIP
Production Checklist
□ Security
  ├── Disable GraphiQL
  ├── Disable introspection
  ├── Implement authentication
  ├── Add rate limiting
  └── Set query complexity limits

□ Performance
  ├── Configure connection pools
  ├── Enable response compression
  ├── Implement caching where appropriate
  └── Set query timeouts

□ Monitoring
  ├── Configure metrics export
  ├── Set up distributed tracing
  ├── Configure structured logging
  └── Create dashboards and alerts

□ Reliability
  ├── Configure health checks
  ├── Set resource limits
  ├── Plan for horizontal scaling
  └── Test failover scenarios

□ Operations
  ├── Document runbooks
  ├── Set up CI/CD pipeline
  ├── Configure log aggregation
  └── Plan incident response
Summary
| Concern | Solution |
|---|---|
| Security | Disable introspection, rate limiting, auth |
| Performance | Query limits, caching, connection pools |
| Monitoring | Micrometer metrics, tracing, structured logs |
| Reliability | Health checks, resource limits, replicas |
| Deployment | Docker, Kubernetes, proper JVM settings |
Production readiness is about more than just code. It's about observability, reliability, and security. Invest in these areas, and your Spring GraphQL API will serve you well under real-world conditions.
Congratulations on making it through this series! You now have the knowledge to build, secure, optimize, and operate Spring GraphQL applications at any scale.
This post went live with GraphiQL enabled and introspection on, the first two things its own checklist tells you to turn off.